

Key Takeaways
- Tennesseans’ health and well-being has a complex and mutually influential relationship with our economic prosperity. Each one affects the other.
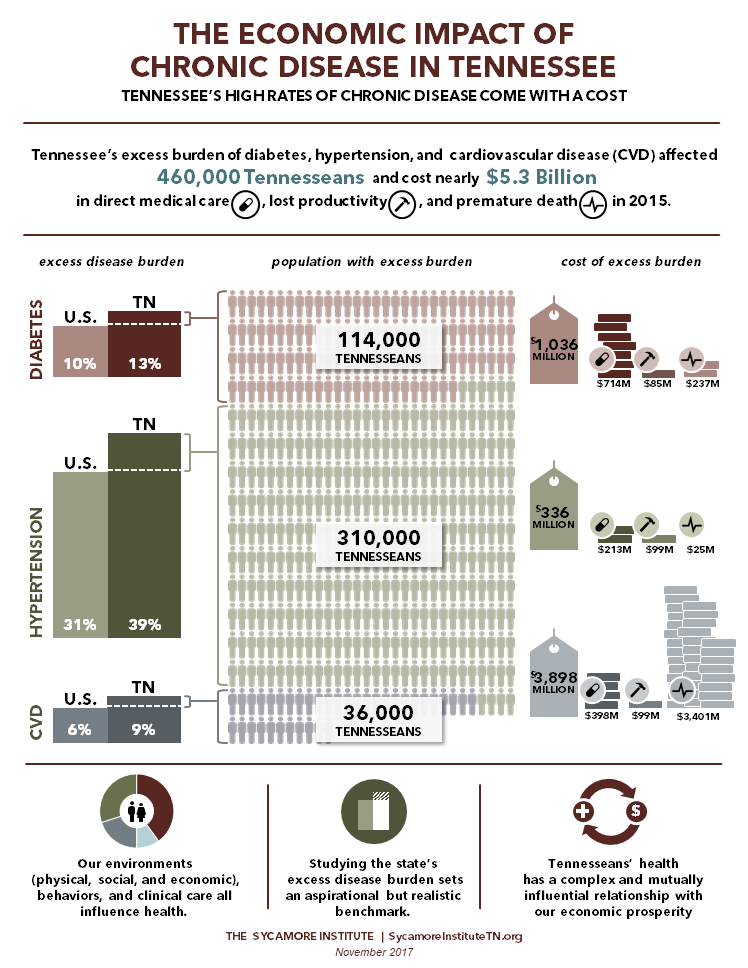
- Diabetes, hypertension, and cardiovascular disease affected 460,000 additional Tennesseans in 2015 due to state prevalence rates exceeding the national rates.
- This excess burden of these 3 diseases alone cost Tennessee nearly $5.3 billion in 2015 in direct medical care, lost productivity, and premature death.
The Excess Cost of Diabetes, Hypertension, and Cardiovascular Disease to Tennessee Taxpayers and Businesses
Higher rates of chronic disease in Tennessee have a cost — including higher health care expenditures, lost productivity, decreased quality of life, and premature death. Many of these chronic diseases are considered preventable. To better understand how preventable chronic disease affects Tennessee, this study estimates the economic impact that achieving aspirational-but-realistic reductions in the prevalence of 3 chronic conditions might have on our state.
This study was commissioned by The Governor’s Foundation for Health and Wellness and conducted by The Sycamore Institute. Click the buttons below to access PDFs of the full study and this executive summary. Additional charts and graphics, including a summary infographic, are available at the bottom of this page.
Overview of Chronic Disease in the U.S. and Tennessee
Chronic disease is the leading cause of disability, morbidity, and mortality in the United States. (1) (2) In 2014, chronic conditions accounted for 7 of the top 10 causes of death. (3) Many of these conditions are preventable but have become increasingly prevalent. For example, the share of American adults with hypertension rose from 29% in 2000 to 34% in 2014. The proportion with diabetes grew from 9% to 13%.i (4) Half of adults in the U.S. had at least one chronic condition in 2012, and 25% had two or more, according to one estimate. (5)
The impact of chronic disease is far-reaching. Chronic health conditions affect individuals’ quality of life and put a burden on families, businesses, communities, and our health care system. This report examines the prevalence of chronic disease in Tennessee and estimates the economic impact of the state’s higher-than-average rates of three specific chronic conditions: diabetes, hypertension, and cardiovascular disease (CVD).
Tennessee has higher rates of chronic disease and chronic disease-related mortality than the U.S. as a whole (Figure 1 and Table 1). Compared to other parts of the country, southern states tend to have higher rates of chronic disease and poorer health outcomes. (6)
Figure 1

Table 1
| Cause of Death (*indicates chronic condition) | Tennessee (per 100,000) |
United States (per 100,000) |
|---|---|---|
| *Heart diseases | 207.3 | 168.5 |
| *Cancers | 180.5 | 158.5 |
| *Chronic lower respiratory diseases | 54.9 | 41.6 |
| Accidents | 56.4 | 43.2 |
| *Stroke | 46.0 | 37.6 |
| *Alzheimer’s disease | 43.4 | 29.4 |
| *Diabetes | 23.4 | 21.3 |
| Influenza and pneumonia | 23.3 | 15.2 |
| *Kidney diseases and conditions | 14.4 | 13.4 |
| Intentional self-harm (suicide) | 15.7 | 13.3 |
Note: Mortality rates are age-adjusted
Source: U.S. Centers for Disease Control and Prevention (8)
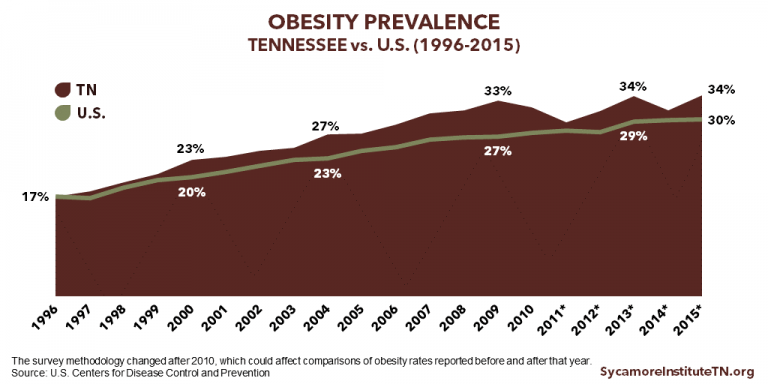
Historical Chronic Disease Trends in Tennessee
Figure 2
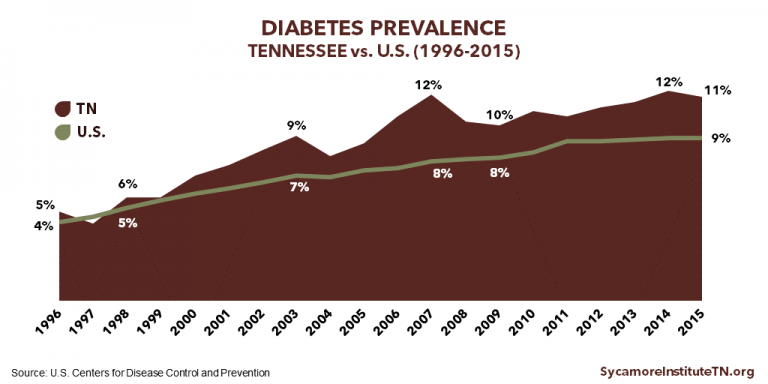
Figure 3
Risk Factors for Chronic Health Conditions
Like all health outcomes, chronic diseases are influenced by the drivers of health (see Page 5). Three factors are primarily responsible for the elevated chronic disease burden in the United States (9):
- Health Behaviors Poor nutrition, a lack of physical activity, tobacco consumption, and excessive alcohol intake increase a person’s risk of developing a chronic disease and related morbidity and mortality.(1)
- Social and Economic Factors Populations and individuals with lower incomes, lower levels of education, and higher rates of poverty are at increased risk of developing a chronic disease and related morbidity and mortality. (10)
- Aging of the Population The number of Americans ages 65 years and over is expected to double by 2050. As people age, they are more likely to develop a chronic health condition. (11) (12) In 2015, 70% of Medicare beneficiaries ages 65 and over in Tennessee had two or more chronic health conditions. (13)
Many of the risk factors for chronic health conditions can be modified and influenced. As a result, many chronic conditions are considered preventable. (9)
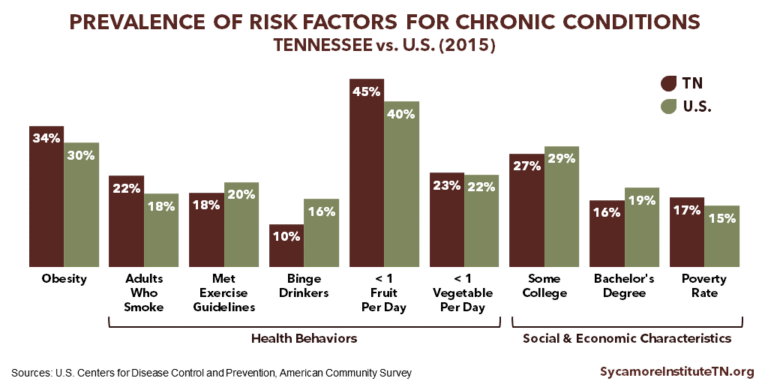
In Tennessee, rates of key health behaviors and the social and economic characteristics that contribute to chronic health conditions are higher than the national rates (Figure 4). For example, Tennessee has higher rates of smoking, obesity, and poverty and lower rates of exercise and educational attainment than the nation as a whole. In some areas, however, Tennessee performs better including higher rates of fruit and vegetable consumption and lower rates of binge drinking.
Figure 4
What Influences Health?
Health means more than just health care. While access to clinical care is a contributing factor, health behaviors and the physical, social, and economic environments in which people live, work, and play are also major drivers of health (Figure 5). Relative to other drivers of health, the social and economic environment have the largest effect on individual and population health. (48)
Figure 5
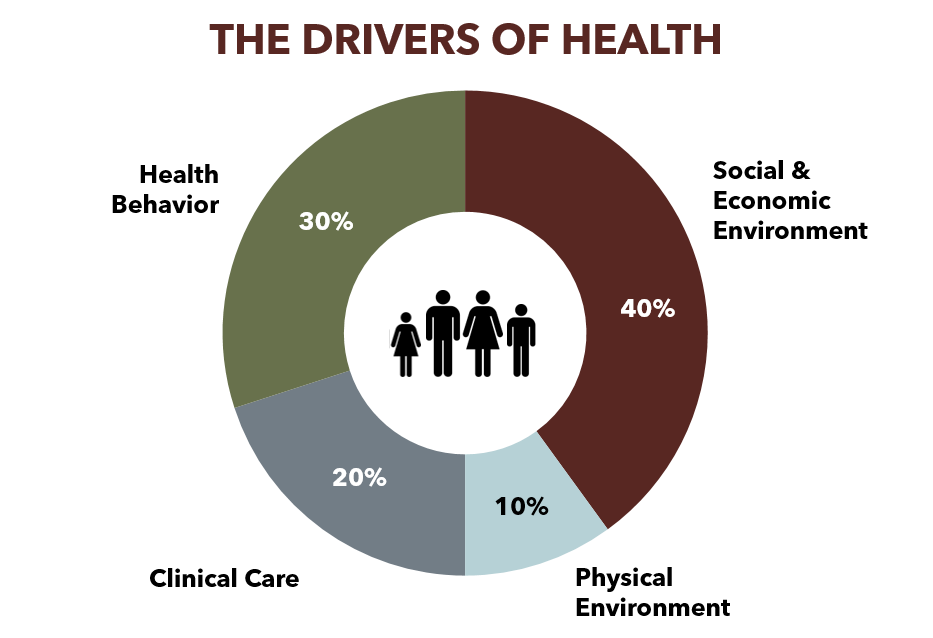
The factors that influence health are complex and interconnected. For example, individuals’ health behaviors are a personal choice, but a person’s environment can encourage or discourage certain behaviors. In the context of chronic conditions, healthy eating and exercise are two examples of how other drivers of health can influence health behaviors.
Unhealthy eating patterns and a lack of physical activity can both contribute to obesity. Environmental factors also influence risks for obesity — including access to healthy and affordable food, neighborhood exposure to fast food restaurants, access to recreational facilities and parks, and the relative costs of foods with greater nutritional value and fewer calories. (49) At the same time, transportation and infrastructure systems can impact the amount of time and the types of opportunities people have to engage in physical activity. (54)
See the Sycamore Institute’s Tennessee Health & Well-Being Index for more information about the drivers of health in our state.
The Economic Burden of Chronic Health Conditions
Chronic health conditions affect our economy in a number of ways ranging from increased medical spending by employers to harder-to-quantify impacts from premature death.
Health expenditures represent a growing share of the U.S. economy, and chronic health conditions account for the majority of this spending. In 2015, national health expenditures were $3.2 trillion, which was 18% of all U.S. spending. (15) Chronic diseases accounted for the majority of this spending. In 2010, for example, 86% of all health care spending was for individuals with one or more chronic health conditions. (16)
The health and well-being of individuals and populations has an economic and financial impact on governments, businesses, and individual households. The federal government, households, state and local governments, and private businesses all pay a portion of Americans’ health care costs (Figure 6). As a result, many stakeholders share the economic burden of chronic health conditions.
Figure 6

The costs of chronic disease also include significant costs associated with lost productivity. Chronic conditions can cause people to miss work (i.e. absenteeism), be less productive while at work (i.e. presenteeism), or be unable to work entirely. (18) (19) (20) (21) (22)
In addition to medical costs and lost productivity, chronic conditions often cause premature death, which has harder-to-quantify impacts on society. People make a range of contributions to society everything from spending time with their families to paying taxes. When individuals die prematurely, these contributions are cut short.
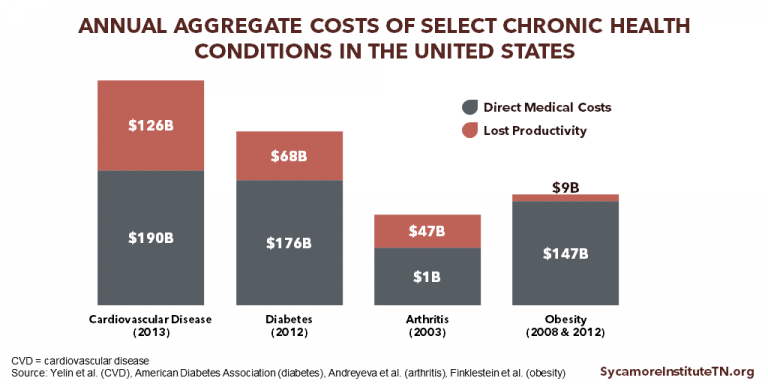
Figure 7 displays national estimates of the annual direct medical costs and costs associated with lost productivity for select chronic conditions in the United States.
The Health and Economic Impact of Smoking
According to the most recent data available, smoking cost Tennessee an estimated $2.7 billion in health care spending in 2009 because of its link to a number of chronic conditions and premature death (Figure 8). Nationally, smoking accounts for as much as 14% of all health care expenditures and costs more than $300 billion a year in direct medical costs ($170 billion) and lost productivity ($156 billion). (56) (58)
Smoking is the country’s leading cause of preventable death. It is linked to poorer overall health and a number of chronic conditions including cancer, stroke, cardiovascular disease (CVD), diabetes, and chronic obstructive pulmonary disease (COPD). (56)
Smoking is responsible for an estimated 480,000 deaths per year nationwide. (56) Smoking is linked to a 10-year shorter life expectancy. (57)
Tennessee has the 8th highest rate of smoking in the United States. In 2016, 22% of adult Tennesseans were current smokers compared to 17% of adults nationally (Figure 9).
Figure 8
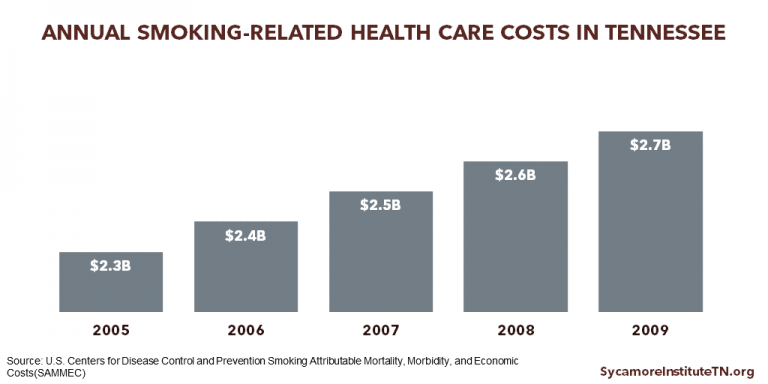
Figure 9

Figure 7
Our Findings
Tennessee’s high rates of chronic disease have a significant economic impact on health care spending and worker productivity as well as the costs that come with premature death.
Tennessee’s Excess Chronic Disease Burden
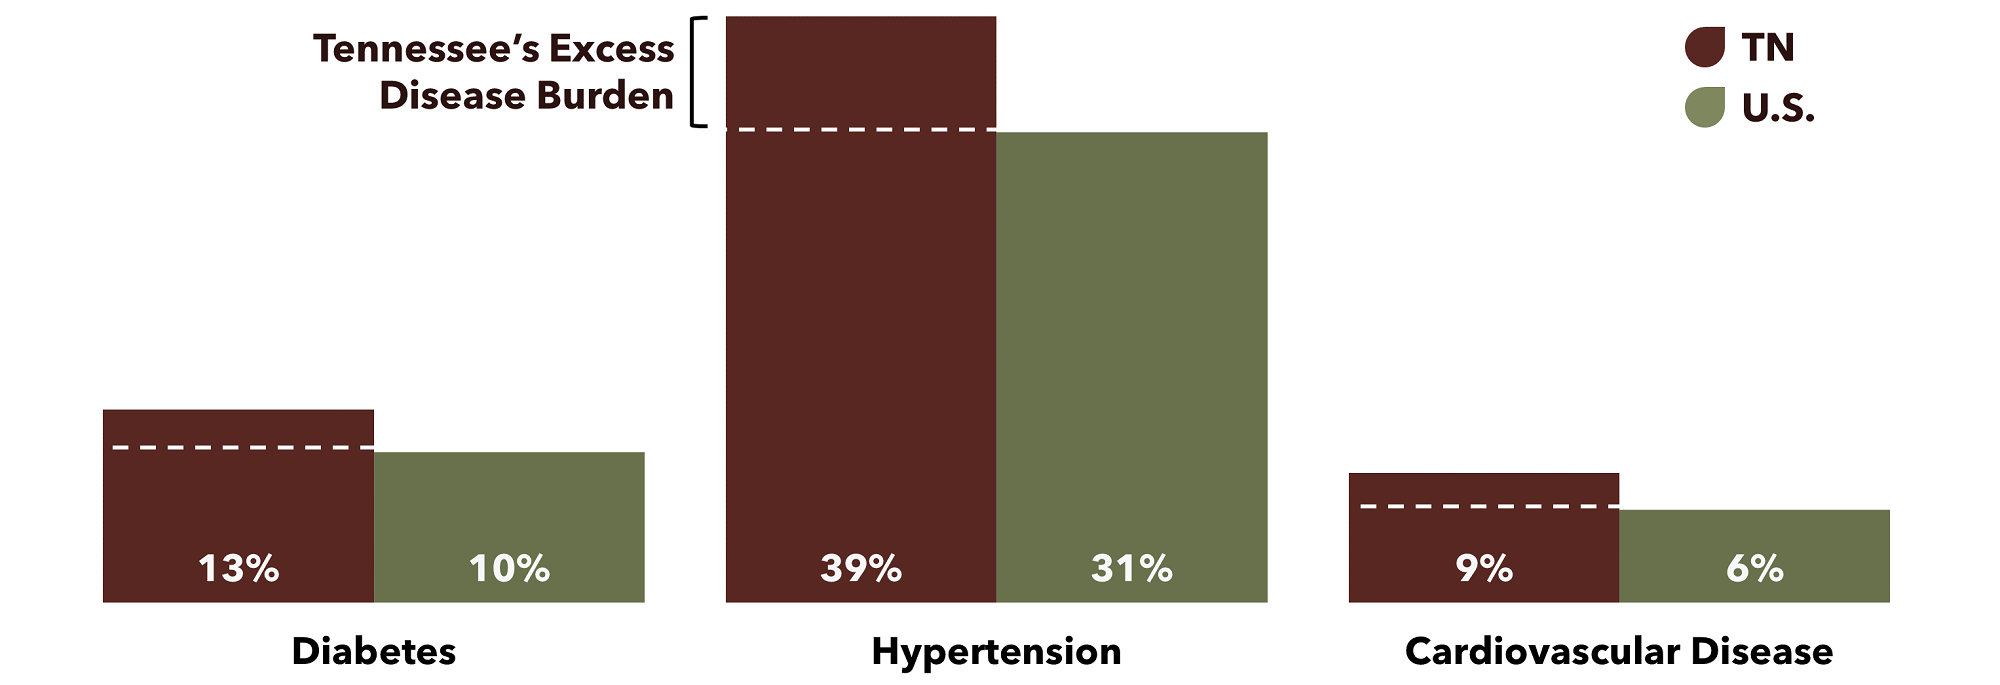
In 2015, the difference between Tennessee’s rates of diabetes, hypertension, and cardiovascular disease (CVD) and the U.S. rates meant these three chronic conditions alone affected 460,000 additional Tennesseans.
- The difference between Tennessee’s 13% prevalence of diabetes and the national rate of 10% amounts to about 114,000 Tennesseans.
- The difference between Tennessee’s 39% prevalence of hypertension and the national rate of 31% amounts to about 310,000 Tennesseans.
- The difference between Tennessee’s 9% prevalence of CVD and the national rate of 6% amounts to about 37,000 Tennesseans with cardiovascular disease.
Why “Excess” Disease Burdens and Costs?
Figure 10
Our Approach
Read more about the analytic approach used in this study including limitations, assumptions, and technical definitions as well as additional high and low estimates beginning on page 16.
Overview of Excess Cost Estimates
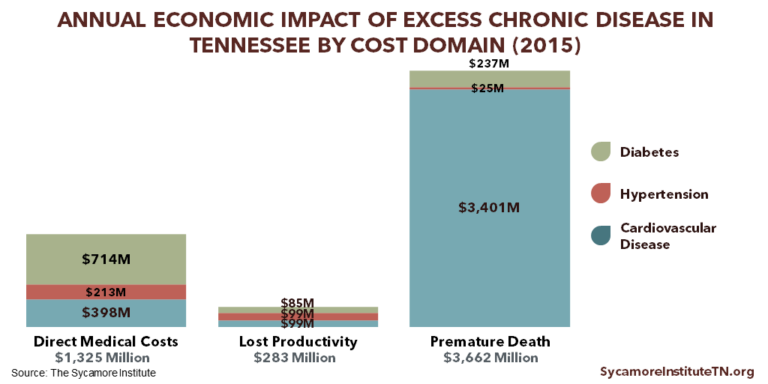
In 2015, the prevalence of diabetes, hypertension, and cardiovascular disease (CVD) in Tennessee in excess of the national rates cost Tennessee nearly $5.3 billion in excess costs. Broken down by chronic condition, excess rates of diabetes cost $1.0 billion, hypertension $336 million, and CVD $3.9 billion (Figure 11). By cost domain, direct medical costs were $1.3 billion, lost productivity $283 million, and premature death $3.7 billion (Figure 12). The full results of our analysis (including our high and low estimates) can be found in the Appendix.
Figure 11
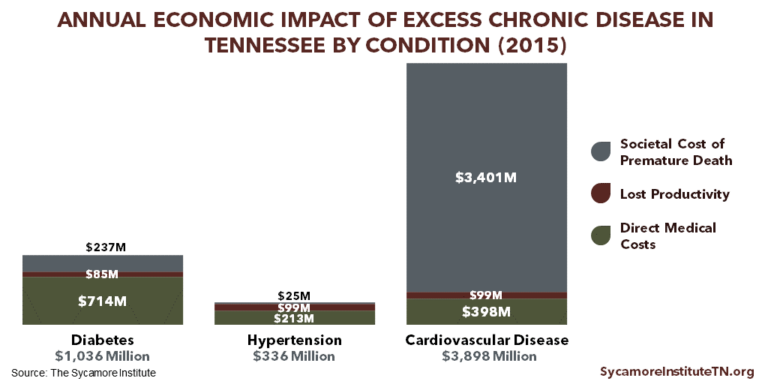
Figure 12
EXCESS DIRECT MEDICAL COSTS
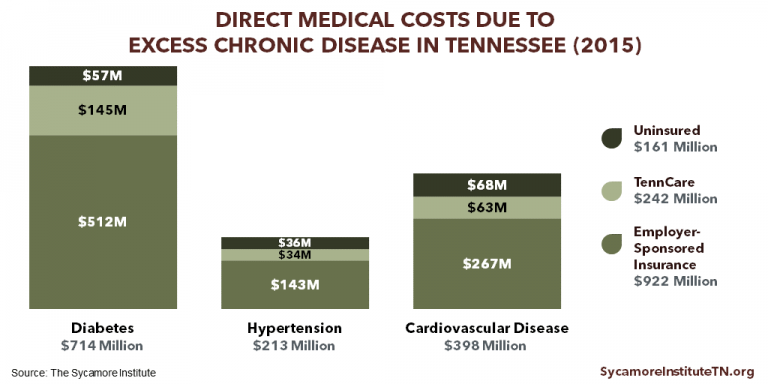
In 2015, the estimated direct medical costs for Tennessee’s excess prevalence of diabetes, hypertension, and cardiovascular disease (CVD) was roughly $1.3 billion (Figure 13).
Excess Direct Medical Costs by Chronic Condition
- Diabetes: $714 million, or 54% of the total
- Hypertension: $213 million, or 16% of the total
- CVD: $398 million, or 30% of the total
Excess Direct Medical Costs by Coverage Type
- Data for 2015 indicated that an estimated 2.4 million Tennesseans ages 18-64 received coverage through their employer, 558,000 were enrolled in TennCare, and 601,000 were uninsured. (14)
- Employer-Sponsored Insurance: $922 million, or 70% of the total
- TennCare: $242 million, or 18% of the total
- Uninsured: $161 million, or 12% of the total
The full results of our analysis, including the range of estimates by disease and type of health insurance coverage, can be found in the Appendix.
Figure 13
EXCESS LOST PRODUCTIVITY COSTS
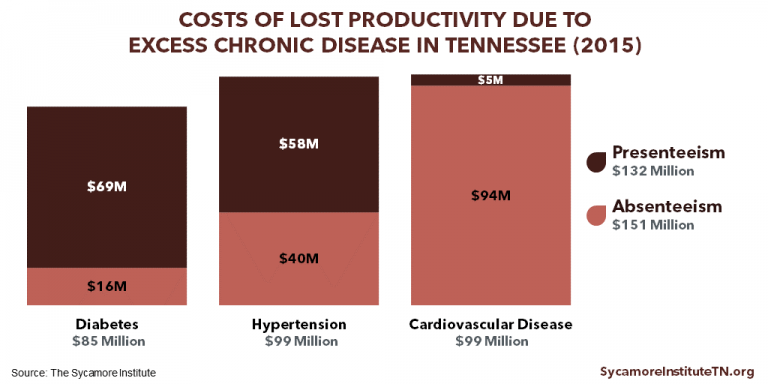
In 2015, the estimated lost productivity cost to Tennessee employers and workers for Tennessee’s excess prevalence of diabetes, hypertension, and cardiovascular disease (CVD) was roughly $283 million (Figure 14). An estimated 2.5 million Tennesseans were employed full-time that year. (27)
Excess Lost Productivity Costs by Chronic Condition
- Diabetes: $85 million, or 30% of the total
- Hypertension: $99 million, or 35% of the total
- CVD: $99 million, or 35% of the total
Excess Lost Productivity Costs by Component of Lost Productivity
- Absenteeism (i.e. missing work due to illness): $151 million, or 53% of the total
- Presenteeism (i.e. lower on-the-job productivity due to illness): $132 million, or 47% of the total
- For diabetes and hypertension, presenteeism was a more costly component of lost productivity. Absenteeism was a more costly component for cardiovascular disease.
The full results of our analysis, including the range of estimates by disease, can be found in the Appendix.
Figure 14
EXCESS SOCIETAL COSTS FROM PREMATURE DEATH
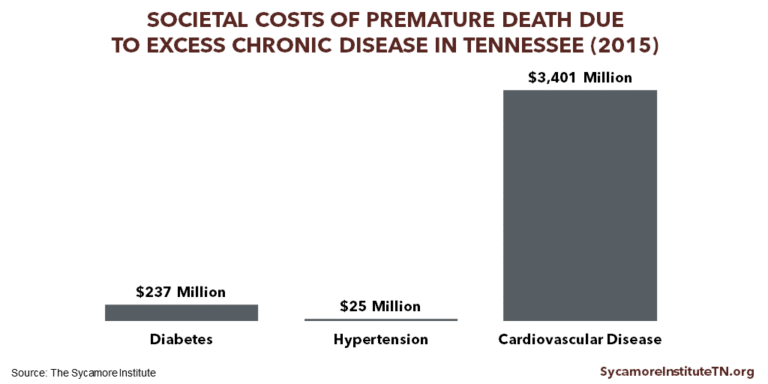
In 2015, the estimated societal costs for Tennessee’s excess premature mortality attributable to diabetes, hypertension, and cardiovascular disease (CVD) was roughly $3.7 billion (Figure 15).
Excess Societal Costs by Chronic Condition
- Diabetes: $237 million, or 6% of the total
- Hypertension: $25 million, or 1% of the total
- CVD: $3.4 billion, or 93% of the total
Placing a monetary value on lost life is a difficult and inherently incomplete consideration of individual worth. These estimates, however limited, help quantify the loss society incurs due to premature death.
The full results of our analysis, including a display of mortality rates by age range in Tennessee and the U.S. and the range of estimates by disease, can be found in the Appendix.
Figure 15
DISCUSSION
Tennesseans’ health and our state’s economy have a complex and mutually influential relationship. Economic growth and prosperity are among the many factors that influence Tennesseans’ health and well-being. The estimates produced in this study begin to quantify and shed light on one important way that Tennesseans’ health and well-being also affect our economy.
IMPLICATIONS FOR TAXPAYERS IN TENNESSEE
Tennessee’s increased burden of chronic disease results in higher health care costs in taxpayer-funded programs like TennCare, our state’s Medicaid program. Health care costs are rising faster than inflation and state revenues. As health care costs increase, states are spending an increasing share of their budgets on health care. (28) TennCare has constrained its per-enrollee cost growth better than most other states’ Medicaid programs. (29) However, the state’s higher rates of chronic disease necessarily mean that Tennessee is spending more on treating chronic conditions than it would if disease rates were lower.
Improving the health of Tennesseans could free up limited state taxpayer resources for other policy priorities like increased spending in other areas or state tax reductions. Based on this study’s estimates, if Tennessee’s rates of diabetes, hypertension, and CVD were more in line with the national rate, total state and federal funding for TennCare could be reduced by $240 million annually. (The estimated cost savings do not account for the cost of any state-funded programs and interventions aimed at reducing chronic disease rates.) For context, $240 million is roughly equivalent to the combined annual budgets for the Department of Economic and Community Development and the Legislature. In addition, the impact on the uninsured could potentially reduce taxpayer spending for uncompensated care.
IMPLICATIONS FOR TENNESSEE’S BUSINESSES AND WORKFORCE
Tennessee’s higher-than-average burden of chronic disease raises employers’ costs for health care and productivity loss. Based on this study’s estimates, if Tennessee’s rates of diabetes, hypertension, and CVD were more in line with the national rate, employers in the state could reduce their health care costs by $920 million annually and increase their full-time employees’ productivity by over $280 million annually.
Improving Tennesseans’ health could save employers money and increase their productivity, which could lead to higher wages and greater economic output for the state. The key components of these improvements are slowing the growth of health care costs and increasing worker productivity both of which may have positive spillover effects for businesses and workers.
Evidence suggests that the rising cost of employer-sponsored health insurance has slowed wage growth and increased employees’ out-of-pocket health spending. Increasing rates of chronic disease have contributed to the growth in health care costs over the last several decades. (1) As employers spend an increasing amount on health insurance for their employees, many look for strategies to help control these costs. For example, businesses may limit wage increases, offer less comprehensive health benefits, and increase premiums and/or cost-sharing requirements. (30) (31) Available data show that Tennessee workers’ wages have increased at a much slower rate than deductibles and health care costs. (32)
The connection between peoples’ health and their productivity is well established. Healthier people are more likely to work or actively seek work than people in poor health. (18) (19) (20) At the same time, healthier workers are more productive and miss fewer days of work for health reasons. (21) (22) This means that Tennessee’s relatively higher rates of chronic disease may diminish our workforce’s productivity compared to other states.
Research suggests that improving the health of Tennessee’s workers could also increase the productivity of their fellow co-workers, generating even larger economic gains. The effects of lost productivity are not limited to the specific job that an employee performs. Absenteeism among employees with chronic health conditions can negatively impact their co-workers. When co-workers are absent, other employees may be more stressed or overwhelmed due to an increased workload. (33) Employers may also use time and resources to hire temporary workers or train another worker to complete new tasks. With many jobs, employees are not interchangeable. Employees often possess job-specific knowledge and other intangible qualities that have been developed over time and are not easily transferrable. (35) Our estimates of excess lost productivity costs do not include these spillover effects and may underestimate the costs of loss productivity.
PARTING WORDS
This study serves as a starting point for quantifying the economic impact of Tennessee’s high rates of chronic disease many of which are preventable. Because of the complex set of factors that influence health, our state’s recent economic growth has the potential to improve the health of Tennesseans. At the same time, this study shows that the health and well-being of Tennesseans can impact our ability to make continued strides in growing our economy and increasing prosperity.
References
REFERENCES
- U.S. Centers for Disease Control and Prevention (CDC). Chronic Disease Overview. Chronic Disease Prevention and Health Promotion. [Online] June 2017. https://www.cdc.gov/chronicdisease/overview/index.htm
- —. Summary of Health Statistics for the U.S. Population: National Health Interview Survey, 2012. Vital and Health Statistics, Series 10, Number 259. [Online] December 2013. https://www.cdc.gov/nchs/data/series/sr_10/sr10_259.pdf
- —. Health, United States, 2015. National Center for Health Statistics. [Online] 2016. https://www.cdc.gov/nchs/data/hus/hus15.pdf#019
- —. Health, United States, 2016. [Online] 2016. https://www.cdc.gov/nchs/data/hus/hus16.pdf#053
- Ward, Brian W, Schiller, Jeannine S and Goodman, Richard A. Multiple Chronic Conditions Among US Adults: A 2012 Update. Preventing Chronic Disease. [Online] 2014. https://www.cdc.gov/pcd/issues/2014/13_0389.htm
- Artiga, Samantha and Damico, Anthony. Health and Health Coverage in the South: A Data Update. Kaiser Family Foundation. [Online] February 2016. http://www.kff.org/disparities-policy/issue-brief/health-and-health-coverage-in-the-south-a-data-update/
- U.S. Centers for Disease Control and Prevention (CDC). 2015 Behavioral Risk Factor Surveillance System. [Online] https://www.cdc.gov/brfss/brfssprevalence/
- —. Underlying Cause of Death 1999-2015. WONDER Online Database. [Online] December 2016. [Cited: July 5, 2017.] http://wonder.cdc.gov/ucd-icd10.html
- Bauer, Ursula E, et al. Prevention of Chronic Disease in the 21st Century: Elimination of the Leading Preventable Causes of Premature Death and Disability in the USA. The Lancet. [Online] 2014. http://www.commed.vcu.edu/IntroPH/Chronic%20Diseases/2014/CDUSA_Lancetuly14.pdf
- Shaw, Kate M, et al. Chronic Disease Disparities by County Economic Status and Metropolitan Classification, Behavioral Risk Factor Surveillance System, 2013. Preventing Chronic Disease. [Online] September 2016. https://www.cdc.gov/pcd/issues/2016/16_0088.htm
- Ortman, Jennifer M, Velkoff, Victoria A and Hogan, Howard. An Aging Nation: The Older Population in the United States. Current Population Reports, U.S. Census Bureau. [Online] May 2014. https://www.census.gov/prod/2014pubs/p25-1140.pdf
- Dexter, Paul R, et al. Preparing for an Aging Population and Improving Chronic Disease Management. AMIA Annual Symposium Proceedings Archive. [Online] November 2010. https://www.ncbi.nlm.nih.gov/pmc/articles/PMC3041380/
- U.S. Centers for Medicare and Medicaid Services (CMS). Multiple Chronic Conditions – Prevalence State/County Level: All Beneficiaries by Age, 2007-2015. [Online] May 10, 2017. https://www.cms.gov/Research-Statistics-Data-and-Systems/Statistics-Trends-and-Reports/Chronic-Conditions/MCC_Main.html
- U.S. Census Bureau. 2015 American Community Survey 1-Year Estimates. [Online] Accessed via factfinder.census.gov.
- U.S. Centers for Medicare and Medicaid Services (CMS). National Health Expenditures 2015 Highlights. [Online] https://www.cms.gov/Research-Statistics-Data-and-Systems/Statistics-Trends-and-Reports/NationalHealthExpendData/downloads/highlights.pdf
- Gerteis, Jessie, et al. Multiple Chronic Conditions Chartbook: 2010 Medical Expenditure Panel Survey Data. Agency for Healthcare Research and Quality. [Online] April 2014. https://www.ahrq.gov/sites/default/files/wysiwyg/professionals/prevention-chronic-care/decision/mcc/mccchartbook.pdf
- U.S. Centers for Medicare & Medicaid Services (CMS). National Health Expenditure Fact Sheet. National Health Expenditure Data. [Online] June 14, 2017. https://www.cms.gov/research-statistics-data-and-systems/statistics-trends-and-reports/nationalhealthexpenddata/nhe-fact-sheet.html
- Cai, Lixin. The Relationship Between Health and Labour Force Participation: Evidence from a Panel Data Simultaneous Equation Model. Melbourne Institute Working Paper No. 1/07, Melbourne Institute of Applied Economic and Social Research, The University of Melbourne. [Online] March 2007. https://www.researchgate.net/profile/Lixin_Cai/publication/222518037_The_Relationship_Between_Health_and_Labour_Force_Participation_Evidence_From_a_Panel_Data_Simultaneous_Equation_Model/links/0912f508ed51f457a1000000.pdf
- Rumball-Smith, Juliet, et al. Diabetes Associated with Early Labor-Force Exit: A Comparison of Sixteen High-Income Countries. Health Affairs. [Online] January 2014. http://content.healthaffairs.org/content/33/1/110.full
- Maurer, Jürgen, Klein, Roger and Vella, Francis. Subjective Health Assessments and Active Labor Market Participation of Older Men: Evidence from a Semiparametric Binary Choice Model with Nonadditive Correlated Individual-Specific Effects. IZA Discussion Papers, No. 3257, Insitute of Labor Economics (Germany). [Online] 2007. https://www.econstor.eu/bitstream/10419/35226/1/56298514X.pdf
- Bloom, David E and Canning, David. The Health and Wealth of Nations. Science. [Online] 2000. http://kie.vse.cz/wp-content/uploads/Bloom-Canning-2000.pdf
- Gifford, Brian. Linking Workforce Health to Business Performance Metrics. Integrated Benefits Institute. [Online] September 2015. https://ibiweb.org/?ACT=65&id=nNXqF1ZCrmSMdVQt347T7CLC_og7FCWMqISJKp2Lni1Ooi0rCbTzoT-9JtA55Cdw0Wj-f0R9KMEWEqZ57_boouQ5-N9NyZyucyL0_n-Nl0ysPDgDeiwDi6TPBnU0ObI6
- Yelin, Edward, et al. Medical Care Expenditires and Earnings Losses Among Persons with Arthritis and Other Rheumatic Conditions in 2003, and Comparisons with 1997. Arthritis & Rheumatology. [Online] 2007. https://www.ncbi.nlm.nih.gov/pmc/articles/PMC2925686/#
- American Diabates Association. Economic Costs of Diabetes in the U.S. in 2012. Diabetes Care. [Online] 2013. http://care.diabetesjournals.org/content/diacare/early/2013/03/05/dc12-2625.full.pdf
- Andreyeva, Tatiana, Luedicke, Joerg and Wang, Y Claire. State-Level Estimates of Obesity-Attributable Costs of Absenteesim. Journal of Occupational and Environmental Medicine. [Online] November 2014. https://www.ncbi.nlm.nih.gov/pmc/articles/PMC4225558/
- Finkelstein, Eric A, et al. Annual Medical Spending Attributtable to Obesity: Payer- and Service-Specific Estimates. Health Affairs. [Online] 2009. http://content.healthaffairs.org/content/28/5/w822.full.pdf+html
- U.S. Census Bureau. Current Population Survey, Annual Social and Economic Supplement. [Online] 2016. https://www.census.gov/cps/data/cpstablecreator.html
- National Association of State Budget Officers (NASBO). The Fiscal Survey of States. [Online] 2017. http://www.nasbo.org/reports-data/fiscal-survey-of-states
- Pellegrin, Mandy. Understanding Medicaid and TennCare: Key Concepts and Context to Know. The Sycamore Institute. [Online] June 1, 2017. http://www.sycamoreinstitutetn.org/wp-content/uploads/2017/06/2017.06.01-FINAL-TennCare-101.pdf
- U.S. Department of Health and Human Services (HHS). The Effect of Health Care Cost Growth on the U.S. Economy. Office of the Assistant Secretary for Planning and Evaluation. [Online] September 1, 2007. https://aspe.hhs.gov/system/files/pdf/75441/report.pdf
- Finn, Patrick, et al. Growing Employer Interest in Innovative Ways to Control Healthcare Costs. McKinsey & Company, Healthcare Systems and Services Practice. [Online] May 2017. http://healthcare.mckinsey.com/sites/default/files/Growing-Employer-Interest-In-Innovative-Ways-To-Control-Healthcare-Costs_R8C.pdf
- Schoen, Cathy, et al. State Trends in Premiums and Deductibles, 2003-2011: Eroding Protection and Rising Costs Underscore Need for Action. The Commonwealth Fund. [Online] December 2012. http://www.commonwealthfund.org/~/media/Files/News/News%20Releases/2012/Dec/1648_Schoen_state_trends_premiums_deductibles_2003_2011_1210_EMBARGO.pdf
- Goodman, Paul S and Atkin, Robert S. Effects of Absenteesim on Individuals and Organizations. Carnegie Mellon University, Tepper School of Business. [Online] 1984. http://repository.cmu.edu/cgi/viewcontent.cgi?article=1836&context=tepper
- Santerre, Rexford E and Neun, Stepehn P. Health Economics: Theory, Insights, and Industry Studies. Mason : South-Western CENGAGE Learning, 2010.
- Hadley, Jack, et al. Covering The Uninsured In 2008: Current Costs, Sources Of Payment, And Incremental Costs. Health Affairs. [Online] August 2008. http://content.healthaffairs.org/content/27/5/w399.full
- Coughlin, Teresa, et al. Uncompensated Care for the Uninsured in 2013: A Detailed Examination. Kaiser Fmaily Foundation. [Online] May 30, 2014. http://kff.org/uninsured/report/uncompensated-care-for-the-uninsured-in-2013-a-detailed-examination/
- Stoll, Kathleen and Bailey, Kim. Hidden Health Tax: Americans Pay a Premium. Families USA. [Online] 2009. http://familiesusa.org/sites/default/files/product_documents/hidden-health-tax.pdf
- Goetzel, Ron Z, et al. Health, Absence, Disability, and Presenteesim Cost Estimates of Certain Physical and Mental Health Conditions Affecting U.S. Employers. Journal of Occupational and Environmental Medicine. [Online] 2004. https://pdfs.semanticscholar.org/585f/500adf20d1fec458d7f0460d273aa6070340.pdf
- Uberoi, Namrata and Cohen, Joel. Expenditures for Heart Disease Among Adults Age 18 and Older: Estimates for the U.S. Civilian Noninstitutionalized Population, 2009. Medical Expenditure Panel Survey, Agency for Healthcare Research and Quality. [Online] November 2012. https://meps.ahrq.gov/data_files/publications/st404/stat404.shtml
- Davis, Karen E. Expenditures for Hypertension Among Adults Age 18 and Older, 2010: Estimates for the U.S. Civilian Noninstitutionalized Population. Medical Expenditure Panel Survey, Agency for Healthcare Research and Quality. [Online] 2013. https://meps.ahrq.gov/data_files/publications/st404/stat404.shtml
- Neumann, Peter J, Cohen, Joshua T and Weinstein, Milton C. Updating Cost-Effectiveness: The Curious Resilience of the $50,000-per-QALY Threshold. The New England Journal of Medicine. [Online] August 2014. http://www.nejm.org/doi/pdf/10.1056/NEJMp1405158
- U.S. Bureau of Economic Analysis (BEA). National Income Product Account Tables. Section 1 Domestic Product and Income, Table 1.1.4 Price Indexes for Gross Domestic Product. [Online] Accessed via https://www.bea.gov/iTable/index_nipa.cfm
- Liao, Youlian, et al. Surveillance of Health Status in Minority Communities: Racial and Ethnic Approaches to Community Health Across the U.S. Risk Factor Survey, United States, 2009. Morbidity and Mortality Weekly Report. [Online] May 2011. https://www.cdc.gov/mmwr/preview/mmwrhtml/ss6006a1.htm
- Neuman, Tricia, et al. The Rising Cost of Living Longer: Analysis of Medicare Spending by Age for Beneficiaries in Traditional Medicare. Kaiser Family Foundation. [Online] January 2015. http://files.kff.org/attachment/report-the-rising-cost-of-living-longer-analysis-of-medicare-spending-by-age-for-beneficiaries-in-traditional-medicare
- Susser, Philip and Ziebarth, Nicolas R. Profiling the U.S. Sick Leave Landscape: Presenteesim Among Females. Health Services Research. [Online] December 2016. http://onlinelibrary.wiley.com/doi/10.1111/1475-6773.12471/abstract
- Prieto, Luis and Sacristan, Jose A. Problems and Solutions in Calculating Quality-Adjusted Life Years (QALYs). Health and Quality of Life Outcomes. [Online] 2003. https://www.ncbi.nlm.nih.gov/pmc/articles/PMC317370/
- McGovern, Laura, Miller, George and Hughes-Cromwick, Paul. Health Policy Brief: The Relative Contribution of Multiple Determinants to Health. Health Affairs. [Online] 2014. http://healthaffairs.org/healthpolicybriefs/brief_pdfs/healthpolicybrief_123.pdf
- Melton, Courtnee. Food Insecurity and Obesity in Tennessee: Understanding the Paradox. The Sycamore Institute. [Online] May 16, 2017. http://www.sycamoreinstitutetn.org/wp-content/uploads/2017/05/2017.05.16-FINAL-The-Food-Insecurity-Obesity-Paradox.pdf
- Goodman, Richard, et al. Defining and Measuring Chronic Conditions: Imperatives for Research, Policy, Program, and Practice. Preventing Chronic Disease: Public Health Research, Practice and Policy. [Online] April 25, 2013. https://www.cdc.gov/pcd/issues/2013/12_0239.htm
- Weinstein, Milton C, Torrance, George and McGuire, Alistair. QALYs: The Basics. Value In Health. [Online] 2009. https://www.ispor.org/meetings/Invitational/QALY/Paper2revised.PDF
- Neumann, Peter J and Greenberg, Dan. Is the United States Ready For QALYs? Health Affairs. [Online] 2009. http://content.healthaffairs.org/content/28/5/1366.full
- Melton, Courtnee. How Transportation Impacts Public Health. The Sycamore Institute. [Online] February 21, 2017. http://www.sycamoreinstitutetn.org/wp-content/uploads/2017/02/How-Transportation-Impacts-Public-Health.pdf
- U.S. Centers for Disease Control and Prevention (CDC). Age-Adjusted Percentage of Adults with Diabetes. United States Diabetes Surveillance System. [Online] https://gis.cdc.gov/grasp/diabetes/DiabetesAtlas.html#
- U.S. Department of Health and Human Services (HHS). The Health Consequences of Smoking – 50 Years of Progress: A Report of the Surgeon General. [Online] 2014. https://www.surgeongeneral.gov/library/reports/50-years-of-progress/full-report.pdf
- Jha, Prabhat, et al. 21st-Century Hazards of Smoking and Benefits of Cessation in the United States. The New England Journal of Medicine. [Online] 2013. http://www.nejm.org/doi/full/10.1056/NEJMsa1211128
- Xu, Xin, et al. Annual Healthcare Spending Attributtable to Cigarette Smoking: An Update. American Journal of Preventive Medicine. [Online] 2015. https://www.ncbi.nlm.nih.gov/pmc/articles/PMC4603661/
- U.S. Centers for Disease Control and Prevention (CDC). Smoking-Attributable Mortality, Morbidity, and Economic Costs (SAMMEC) – Smoking-Attributable Expenditures (SAE). [Online] September 8, 2017. https://chronicdata.cdc.gov/Health-Consequences-and-Costs/Smoking-Attributable-Mortality-Morbidity-and-Econo/ezab-8sq5
